
Overview
This course provides practical data analysis skills using Excel, teaching learners to utilise formulas, functions, and Power Pivot to connect to multiple data sources. Key areas covered include data modelling and visualisation, DAX language for data summarisation, statistical techniques for dashboard creation, and data protection guidelines. Learners will also master techniques for cleaning datasets and performing comprehensive data analysis
Course Description & Learning Outcomes
By the end of this course, learners will be able to:
Apply principles of data modelling and visualization to create data models to identify and predict trends and patterns.
Use data science techniques to perform data analysis on data sets.
Apply data protection and legal guidelines to support the creation of business insight reports
Apply DAX language to summarize data to provide business insights from data source.
Apply statistical techniques and formulas to produce analytical dashboards and insight reports.
Join multiple tables using unions to extract data analysis aligned to the domain context.
Create clean required dataset with functions and formulas to visualize data.
Recommended Prerequisites
Learners are required to have basic excel knowledge
Pre-course instructions
This training is relevant to PMETs who are aspiring to move away from just creating spreadsheets onto a data analytics scale using a tool that they are relatively familiar with.
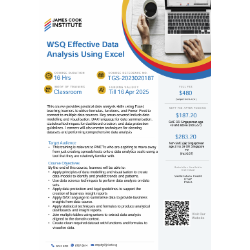
Schedule
Date: 17 Mar 2025, Monday
Time: 9:00 AM - 6:00 PM (GMT +8:00) Kuala Lumpur, Singapore
Location: 150 Orchard Road, Orchard Plaza #06-14, Singapore , Singapore 238841
Agenda
| Day/Time | Agenda Activity/Description |
|---|---|
| Day 1 | Data Modelling & Visualization – Use Power Pivot, Pivot Tables, and Charts for trends and forecasting. Excel Functions for Analysis – Apply advanced Excel functions for data manipulation. Power Pivot & Data Integrity – Create business reports and apply data protection. |
| Day 2 | DAX for Insights – Use DAX to summarize data and generate insights. Statistical Techniques & Dashboards – Apply statistical formulas and Data Analysis Tool Pak. Data Extraction – Join multiple tables for data analysis and visualization. Data Transformation – Clean and validate data for accurate visuals. |
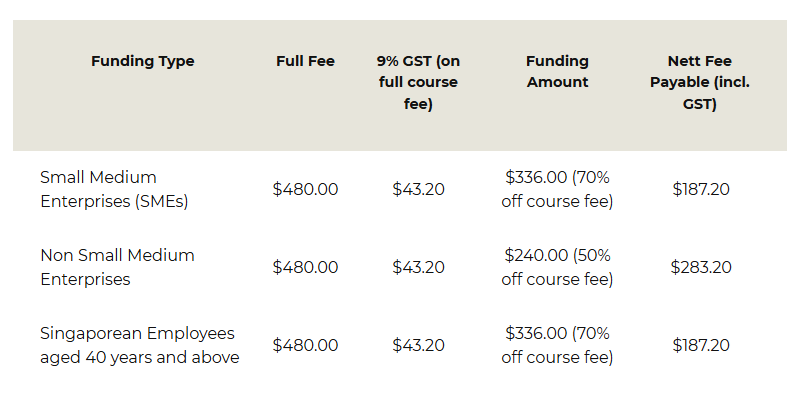
Pricing
Skills Covered
PROFICIENCY LEVEL GUIDE
Beginner: Introduce the subject matter without the need to have any prerequisites.
Proficient: Requires learners to have prior knowledge of the subject.
Expert: Involves advanced and more complex understanding of the subject.
- Data Analytics (Proficiency level: Proficient)
Speakers
Trainer's Profile:
Ms Lim Bee Eng , Associate Trainer , James Cook Institute
She has been conducting office application training programmes such as Microsoft Word, Excel, PowerPoint and Access for end users both at basic and advanced levels. She is also conducting training programmes for ES WSQ - ICDL certification modules. Miss Lim is a licensed IT Power trainer. She has conducted NITLP computer literacy programmes, ES-Basic ICT Skills and Workplace ICT Applications modules. She has conducted training sessions for many companies. They include Elim Church, Fei Yue Family Service Centre, AIA, DOS, IMH, JHS, HGST, DSTA, MOE, OCBC, TTSH, Civica, Hong Leong Finance, The Regent Hotel, Mindef, ABR Holdings, Lim Kim Hai Electric, Panasonic AVC Networks, Renesas Semiconductor, SMRT and many more.
Partners