
Overview
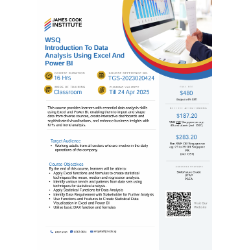
This course provides learners with essential data analysis skills using Excel and Power BI, enabling them to import and shape data from diverse sources, create interactive dashboards and sophisticated visualisations, and enhance business insights with KPIs and trend analysis
Course Description & Learning Outcomes
By the end of this course, learners will be able to:
Apply Excel functions and formulas to create statistical techniques like mean, median and regression analysis.
Identify various trends and patterns from data sets using techniques for statistical analysis.
Apply Statistical Functions for Data Analysis
Identify Data Requirement with Stakeholder for Further Analysis
Use Functions and Features to Create Statistical Data Visualisation in Excel and Power BI
Utilise basic DAX function and formulas
Recommended Prerequisites
Workforce Skills Qualifications (“ES WSQ”) Workplace Literacy (“WPL”) level 3.
Be able to read and write English at a proficiency level equivalent to ES WSQ WPL level 3.
Be able to manipulate numbers at a proficiency level equivalent to ES WSQ Workplace Numeracy (“WPN”) level 3. – Learners to have minimum GCE ‘O’ level or ITE certificate education – Learner should have at least 1 year’s working experience in any industry. – Learners must be able to operate a personal computer, use keyboard and mouse
Schedule
Date: 10 Mar 2025, Monday
Time: 9:00 AM - 6:00 PM (GMT +8:00) Kuala Lumpur, Singapore
Location: 150 Orchard Road, Orchard Plaza #06-14, Singapore , 238841
Agenda
| Day/Time | Agenda Activity/Description |
|---|---|
| Day 1 | 1. Understanding Data Analysis & Statistics – Covers data analysis concepts, benefits, cycle, protection laws, types of data, and statistics. 2. Importing & Shaping Data – Import data from various sources, use functions for preparation, and create interactive dashboards. |
| Day 2 | 3. Statistical Data Visualization in Excel & Power BI – Introduction to Power BI, creating statistical visuals, applying conditional formatting, and using trendlines & slicers. 4. Interactive Visualizations & Dashboards – Use basic DAX functions, create KPIs, scorecards, and gauge visualizations for insights. |
Pricing
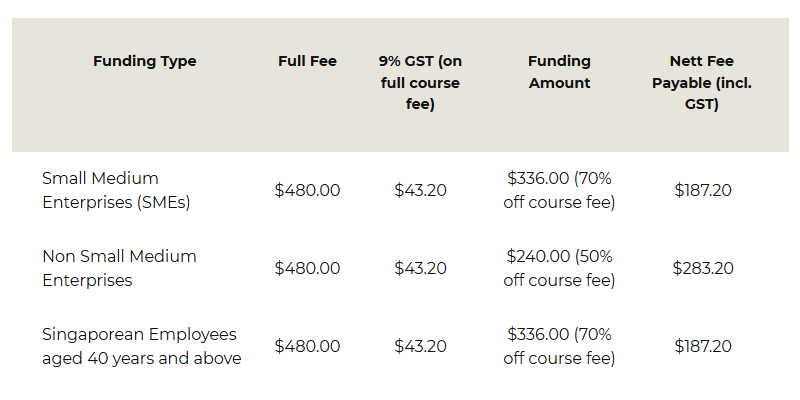
Course fees: SGD$480
Skills Covered
PROFICIENCY LEVEL GUIDE
Beginner: Introduce the subject matter without the need to have any prerequisites.
Proficient: Requires learners to have prior knowledge of the subject.
Expert: Involves advanced and more complex understanding of the subject.
- Data Visualisation (Proficiency level: Proficient)
Speakers
Trainer's Profile:
Mr Sanjiv Venkatram, Associate Trainer, James Cook Institute
Sanjiv is a seasoned professional with 25+ years of experience across North America and APAC, including nearly a decade at Microsoft. His expertise spans engineering, program management, corporate finance, and business operations. In 2018, he founded Prudentia with the mission: "User delight with Microsoft Technology." He designs and delivers training programs, empowering users to leverage Microsoft Power Platform and related tools. Sanjiv also provides expert consultations and develops BI/AI applications for IT leaders. Since 2019, he has trained 1,000+ individuals, earning high praise for his engaging style. His clients include Ministry of Home Affairs, Certis Cisco, MNCs, Microsoft, and a leading logistics company. Sanjiv’s unique approach extends beyond traditional training, focusing on the user journey and fostering adoption and innovation through a consultative method.
Partners