Overview
With the increase in the availability of data, organizations are now grappling with the problem of how to use these data effectively for their business. Data Analytics is the practice of using digital data for understanding insights from data. To unlock the potential contained within data, it is essential for organizations to apply techniques to explore and convey key insights. That is, to tell the story within insights gleaned from data. Well-told data stories are change drivers within any institution. How to connect the data to the key underlying business issues? This course discusses the art and science of data storytelling, techniques for visualising data and the approach to telling compelling stories using data insights for effective and efficient communication.
Course Description & Learning Outcomes
Course will enable participants to:
Understand and apply visualisation techniques and information displays to convey data and findings.
Learn how to produce effective and efficient data visualisations.
Organise the presentation of data to reflect trends and correlations in a visually compelling way.
Present effective data storytelling.

Schedule
End Date: 15 Apr 2025, Tuesday
Location: 11 Research Link, COM 3, 119391
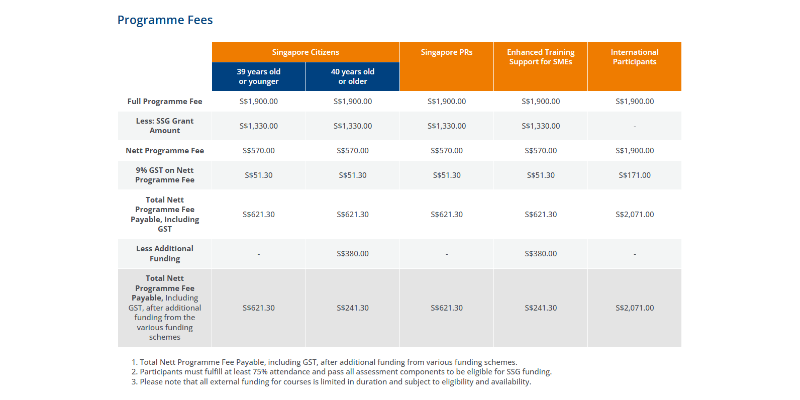
Pricing

Skills Covered
PROFICIENCY LEVEL GUIDE
Beginner: Introduce the subject matter without the need to have any prerequisites.
Proficient: Requires learners to have prior knowledge of the subject.
Expert: Involves advanced and more complex understanding of the subject.
- Business Analytics (Proficiency level: Beginner)


