Overview
In today’s data-focused business world, the ability to characterise and communicate practical implications of quantitative analyses to any stakeholders becomes a crucial skill to master at the workplace.
The richest data is useless if it fails to provide actionable insights or if it does not convey solutions and directions in a way that all stakeholders can comprehend.
Course Description & Learning Outcomes
Join us for this 2-day course and learn how to become a master at communicating business-relevant implications of data analyses using Tableau, the industry-leading software that provides reliable, flexible, and repeatable methods for analysing real-world data. This course investigates visual analytics and related concepts with Tableau through the completion of real-world case studies. Learn in detail how to use Tableau’s platform for visual analytics and business intelligence, which will help you and your stakeholders to see and understand data like never before. Acquire skills in Tableau to connect to multiple data sources, enhance them, and display them using visual analysis techniques. LEARNING OBJECTIVES Understand what is visual analytics, as a subset of the larger business & analytics domain Understand various visual vocabulary and how to apply them Conduct diagnostics through hypothesis generation and validation using Tableau
Recommended Prerequisites
There are no prerequisites for this programme. Prior knowledge on any of the topics is not required.
Schedule
End Date: 23 Feb 2024, Friday
Location: 60 Stamford Road, Level 4, 178900
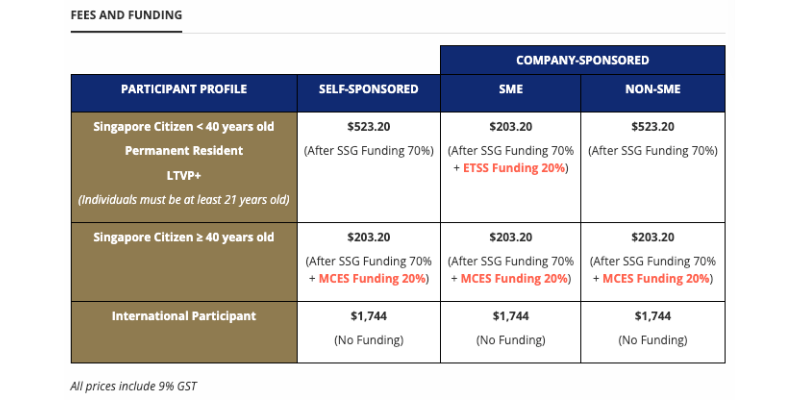
Pricing

Speakers
Trainer's Profile:
Dr. Eric Sandosham, Founder & Partner Red & White Consulting Partners LLP, Singapore Management University
An Affiliate Faculty member of the SMU Academy, Dr. Eric Sandosham is a well-known leader and practitioner in business analytics. Widely recognised across the region as one of the early pioneers in the decision science practice, in 2013, he co-founded Red & White Consulting Partners LLP, a boutique business analytics consultancy that leverages data and analytics to ‘connect the dots’ between People, Products and Profit. Before becoming an entrepreneur, Eric spent 18 years in Citi Asia Pacific. He was the Managing Director and Regional Head of the bank’s Decision Management function for Asia Pacific, where he oversaw a team of more than 300 analysts across 14 markets, contributing to 25% of the consumer bank’s revenues.
Trainer's Profile:
Koo Ping Shung, Adjunct Trainer, Singapore Management University
Koo Ping Shung is an experienced Data Scientist with an MBA degree and has accumulated more than 10 years of relevant experience in the area of analytics. A seasoned trainer in Data Science, Ping Shung has trained and mentored numerous professionals in analytics. He previously held an adjunct position in SMU’s School of Information Systems and is currently an Adjunct Senior Faculty at SUSS. His strong passion and interest in analytics can be seen through his substantial involvement in various analytics interest groups. Other than being the the co-founder of Datascience.SG, Ping Shung was also the former Chairman of the SAS User Group Singapore Working Committee.


