Overview
This course discusses the use of data visualisation in decision making, concepts of Business Performance Measurement and Strategic Business Management Performance Framework. Participants will learn about visualisation tools for various types of data, principles of dashboard design and types of dashboards. Participants will also learn how to create charts using Tableau.
Course Description & Learning Outcomes
By the end of this course, you should be able to: - Discuss the concepts of Business Performance Measurement, Strategic Business Management Performance Framework and Data Visualisation - Compare various stages of Data Visualisation process - Illustrate the dashboard design principles - Evaluate the appropriateness of Data Visualization techniques based on given - Discuss the benefits of Data Visualisation - Use appropriate Data Visualisation techniques based on given data - Develop Business Performance Dashboard using Data Visualisation software - Implement actions to create advanced dashboard navigation
Pre-course instructions
You need to bring along your own laptop and should have Tableau software installed and activated on your own laptop. Registration close date: 27/10/23
Schedule
Date: 10 Nov 2023, Friday
Time: 9:00 AM - 5:00 PM (GMT +8:00) Kuala Lumpur, Singapore
Location: Singapore University of Social Sciences, 463 Clementi Road, 599494
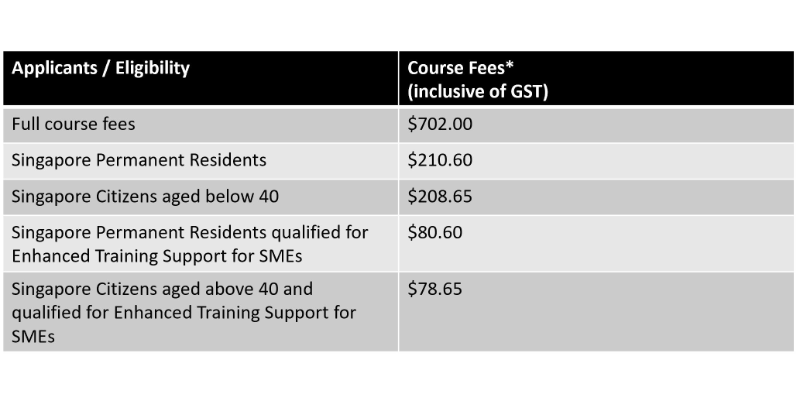
Pricing

Partners


